
Multifamily market signals a bottom — but spring will be the proof
The multifamily rental market appears to have bottomed in late 2025, with January 2026 data showing the first positive rent and occupancy inflections in seven months — but the recovery remains fragile. Apartment REIT earnings calls delivered a collective sigh of cautious optimism, with UDR reporting new lease rate growth improving 550 basis points since October and Camden CEO Ric Campo declaring new supply is “falling like a knife.” Meanwhile, the macro backdrop offered mixed signals: the 30-year mortgage rate fell to 6.01% (lowest since September 2022), but Q4 GDP came in at a disappointing 1.4% and consumer confidence sits near decade lows.
The week’s biggest policy development landed on February 19, when the White House sent draft legislative language to Congress proposing a ban on investors with 100+ single-family homes from acquiring additional properties. As Jay Parsons (RealPage) noted, the threshold targets mid-sized local and regional groups rather than large institutions, exempts build-to-rent, and does not force existing owners to sell. The proposal now faces an uncertain path in Congress. On the supply side, the construction wave that defined 2023–2025 is breaking: deliveries are projected to fall 35–60% from peak across most markets in 2026, setting the stage for rent recovery — though Greg Willett (LeaseLock) warns operators face a growing tension between renewal rent growth (3.6% nationally) and essentially flat move-in rents that could force a strategic reckoning.
The week also brought important housing data delayed by the October–November government shutdown: December multifamily starts surged 11.3% month-over-month to 423,000 units (SAAR), while multifamily permits jumped 15.2% — signaling developer confidence even as broader economic indicators flash caution. The FOMC minutes released February 18 revealed sharp divisions among policymakers, with markets now pricing just two rate cuts for 2026. The spring leasing season beginning in March will be the critical test of whether the bottoming signals translate into sustained momentum.
The macro picture is messy but manageable
The macroeconomic environment facing multifamily investors this week offered a contradictory mosaic of encouraging and concerning signals. On the encouraging side, the January CPI report confirmed inflation cooling to 2.4% year-over-year with shelter costs easing to 3.0% — the lowest shelter reading in over two years and a direct tailwind for apartment operating fundamentals. Greg Willett flagged this in his LinkedIn analysis, noting the positive sequencing: a decent (if narrow) jobs report followed by a favorable inflation print.
The jobs picture, however, demands scrutiny. January’s 130,000 nonfarm payrolls beat expectations of 55,000–70,000, but the composition was troubling. Healthcare accounted for 82,000 of the gains while financial activities shed 22,000 jobs and federal government employment dropped 34,000. As Willett observed, the concentration in a single sector is “concerning” for an industry that needs broad-based professional services, finance, and tech hiring to drive renter demand — particularly in urban cores. The 2025 benchmark revisions were even more sobering: average monthly job gains were revised down to just 15,000 per month, from 49,000 previously.
The week’s biggest macro surprise was the advance Q4 2025 GDP estimate of just 1.4% annualized — well below the 3.0% consensus, though the October–November government shutdown subtracted roughly a full percentage point. Consumer sentiment remains depressed, with the University of Michigan’s final February reading at 56.6, some 32% below the historical average. The Conference Board’s January reading of 84.5 marked the lowest since May 2014, with the expectations component breaching the recession-warning threshold of 80.
Capital markets delivered better news for multifamily borrowers. The 30-year fixed mortgage fell to 6.01% per Freddie Mac — lowest since September 2022 — while agency multifamily lending rates start at roughly 5.18% for 10-year fixed, non-recourse terms. The FHFA increased GSE multifamily lending caps 20.5% to $88 billion each ($176 billion combined) for 2026, a critical backstop given that approximately $90 billion in multifamily debt matures this year, much of it originated at sub-5% rates during 2021–2022.
| Key indicator | Current level | Direction |
|---|---|---|
| 10-Year Treasury | 4.08% | Stable (range-bound 4.03–4.09%) |
| 30-Year Fixed Mortgage | 6.01% | ↓ Lowest since Sep 2022 |
| Agency MF Rate (10-yr) | ~5.18% | ↓ Favorable |
| Fed Funds Rate | 3.50–3.75% | Held; 2 cuts priced for 2026 |
| CPI (Jan YoY) | 2.4% | ↓ Cooling |
| Core PCE (Dec YoY) | 3.0% | ↑ Above target |
| Nonfarm Payrolls (Jan) | +130,000 | Healthcare-driven |
| Unemployment | 4.3% | Stable |
| Q4 2025 GDP | 1.4% | ↓ Shutdown-distorted |
| Michigan Sentiment (Feb) | 56.6 | Near decade lows |
The FOMC minutes released February 18 revealed an unusually divided committee: “several” members support further cuts, “some” favor holding for an extended period, and “several” want rate hikes on the table if inflation proves stubborn. With the Fed Chair transition approaching in May and markets pricing approximately 50 basis points of cuts by year-end, rate uncertainty will remain a defining feature of the 2026 investment landscape.
Rents are inflecting, but the recovery is bifurcated
January 2026 marked what may be a genuine inflection point for apartment rents. RealPage reported effective asking rents increased +0.2% month-over-month — the first positive reading in seven months — while occupancy ticked up 10 basis points to 94.7%. CoStar’s data showed similar momentum, with the U.S. average apartment rent reaching $1,713 (+0.6% YoY) and the firm revising its near-term forecast upward by 60 basis points. Yardi Matrix confirmed the trend: average advertised asking rent hit $1,741, ending five consecutive months of declines.
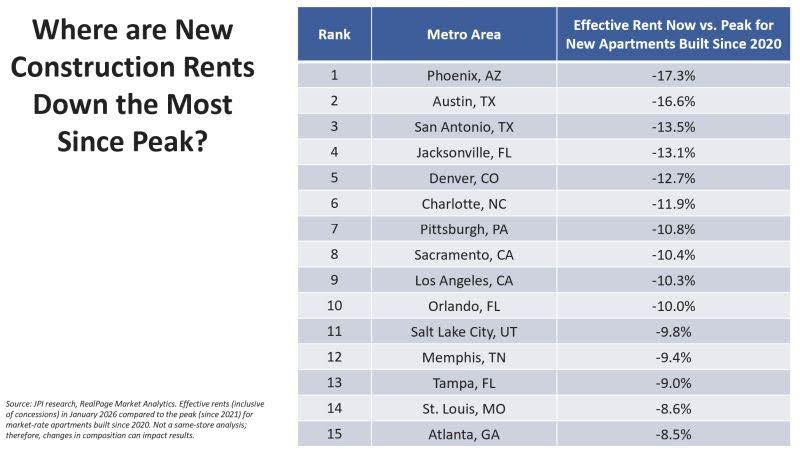
The national averages, however, mask a deeply bifurcated market. Jay Parsons highlighted the divergence in his LinkedIn posts this week, mapping markets where new construction rents have fallen most from peak. Austin leads the nation, with rents down 13–17% from peak depending on the data source (CoStar shows -4.8% to -6.3% YoY; Redfin pegs the decline at 22% from the August 2023 high). Phoenix, San Antonio, Jacksonville, and Denver round out the top five decliners, all down 10% or more from their peaks. The next tier — Charlotte, Pittsburgh, Sacramento, Los Angeles, and Orlando — has seen drops of 10–12% from peak.
Conversely, several markets have reached new all-time rent highs: West Palm Beach, Virginia Beach, Minneapolis, San Jose, and San Francisco. San Francisco’s rent growth registered a remarkable +6.3% YoY per CoStar, powered by a tech sector resurgence and minimal new supply. Virginia Beach leads nationally at roughly +5% YoY on Apartment List data, with Chicago (+3.2%) and San Jose (+3.5%) also outperforming.
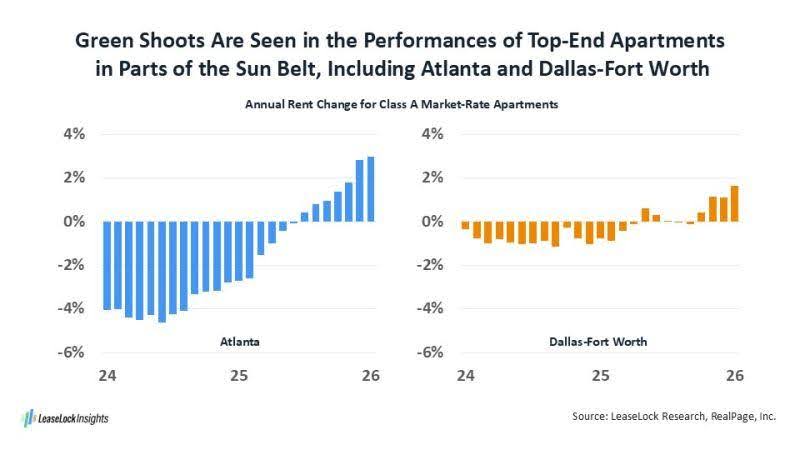
Greg Willett’s analysis of Sun Belt Class A rent recovery adds important texture. Atlanta’s Class A rents are up 3% in early 2026 — a dramatic swing from -2.7% a year ago and -4.1% two years prior. Miami, Orlando, and Jacksonville are tracking similar improvement curves, while Dallas-Fort Worth Class A rents have turned positive at +1.6%. Raleigh-Durham is approaching breakeven, and Houston and Phoenix appear poised to turn positive. This Class A recovery is significant: it suggests the luxury supply glut that hammered Sun Belt markets in 2023–2025 is finally being absorbed.
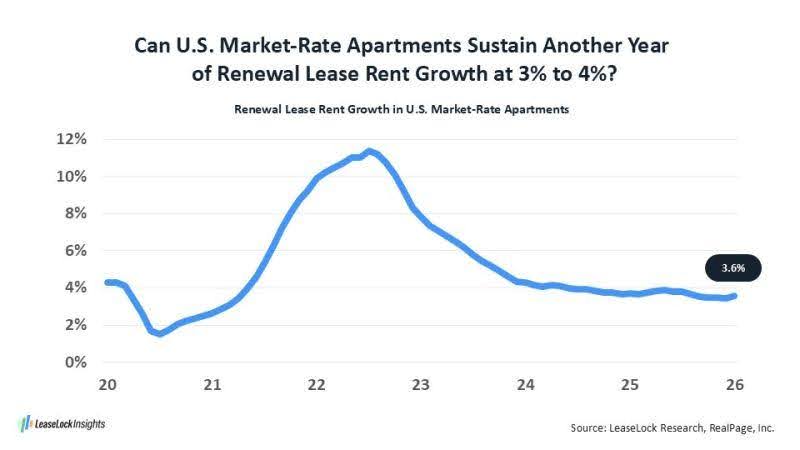
The renewal-versus-move-in rent divergence that Willett flagged deserves close attention. Renewal rents are running at +3.6% nationally while move-in rents remain essentially flat year-over-year. This gap has persisted since spring 2023, and the tension is building. Operators face a strategic choice: accept rent cuts on new leases to maintain occupancy, or hold pricing and risk higher turnover. With retention rates near record highs — driven partly by demographics (older renters are simply stickier) and partly by the $1,200/month gap between average rent and a mortgage payment — most operators are choosing to hold.
The supply cliff is real and arriving fast
The construction wave that reshaped the apartment market is breaking with dramatic speed. After delivering approximately 590,000 units in 2025 (Yardi Matrix) — near the highest levels since the 1970s — the pipeline is contracting sharply. RealPage forecasts just 316,000 deliveries in 2026, while Yardi Matrix projects 450,000. Either figure represents a 35–50% decline from peak. By 2027, completions could fall below 300,000 units — a level NMHC estimates is insufficient to meet projected demand through 2035.
Camden CEO Ric Campo put it vividly on the Q4 earnings call: new supply “has peaked and is falling like a knife.” MAA reported deliveries declining 60%+ from peak in its markets, with new starts down roughly 70%. AvalonBay expects 40% fewer deliveries in its coastal-heavy portfolio in 2026. These aren’t projections — they reflect construction timelines locked in by the dramatic collapse in new starts, which fell from a peak of roughly 708,000 units in 2022 to an estimated 235,000–311,000 in 2025, the lowest in over a decade.
The supply decline is not uniform. Greg Willett’s analysis of urban versus suburban construction patterns reveals the drop-off is more pronounced in urban cores, where high-rise development requires larger capital stacks and more complex financing. Suburban garden-style and mid-rise projects face lower barriers but are also pulling back. Willett suggests watching for a rebound in young adult hiring across professional services, finance, and tech — the demand driver that could justify new urban construction restarts.
On the demand side, 2025 absorption was remarkably strong. Yardi Matrix tracked 519,000 units absorbed, with Q1 2025 alone setting a 30-year record at 138,000 units. However, absorption tapered significantly in the second half as the job market softened. For 2026, the NAA projects absorption of 350,000–400,000 units — which, combined with sharply lower supply, should produce the first meaningful tightening since 2022.
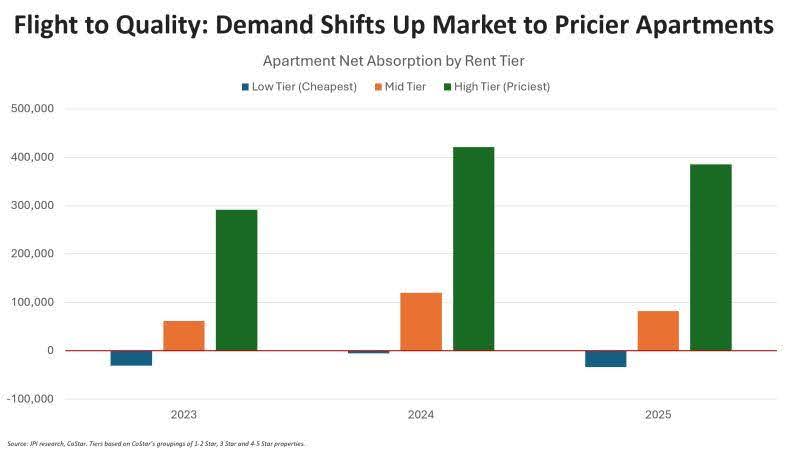
Jay Parsons provided the most granular demand analysis in his LinkedIn posts. Over the past three years, +1.1 million renter households moved into Class A/upper-tier units, with +263,000 in mid-tier and a net loss of 70,000 in lower-tier units (CoStar data). This upward shift was driven primarily by the avalanche of new Class A supply hitting the market at discounted rents, creating a “filtering” effect where Class C rents actually fell more than Class A in high-supply markets like Austin. While this represents good news for renters trading up, the affordable housing shortage remains acute for the roughly 11 million households earning less than $20,000 annually. The supply wave, for all its magnitude, largely bypassed this segment entirely.
December’s delayed housing data offered a surprise: multifamily starts surged 11.3% month-over-month to 423,000 (SAAR), while multifamily permits jumped 15.2% to 515,000. These figures suggest some developers are finding opportunities in the market trough, though elevated construction costs from tariffs and labor shortages (Camden cited costs still only 5–8% below peak) will limit how quickly the pipeline can rebuild.
Capital is returning, but the refinancing wall looms large
Investment activity in the apartment sector is rebuilding from its 2023–2024 trough. Full-year 2025 apartment sales reached $165.5 billion (MSCI Real Capital Analytics), up 9% year-over-year and exceeding the 15-year annual average of $155 billion. Cap rates held steady at 5.7% — unchanged for eight consecutive quarters and the tightest among all major commercial property types. Institutional non-portfolio transactions reached $12.6 billion in 2025, up 43% from 2024 per Essex data.
This week’s notable transaction: 29th Street Capital acquired a 1,225-unit portfolio across three properties in the Washington, D.C. metro area (Largo and Camp Springs, Maryland), marking the firm’s continued expansion in the region with plans for light value-add upgrades.
The more consequential capital markets story, however, is the wave of strategic portfolio repositioning underway among public REITs. Camden Property Trust is marketing 11 California communities with a preliminary valuation of $1.5–2.0 billion, planning to reinvest roughly 60% into Sun Belt markets via 1031 exchanges and deploy ~$650 million on share repurchases. UDR has $700 million in communities actively marketed for sale. Aimco shareholders approved a full liquidation on February 6, with the Chicago portfolio under contract for $455 million to LaTerra Capital. Elme Communities completed a $1.6 billion sale to Cortland Partners and is winding down its remaining nine assets.
The public-private valuation disconnect is driving unprecedented share repurchase activity. With apartment REIT stocks trading at meaningful discounts to private-market values, buybacks have become the preferred capital allocation tool:
- AvalonBay: $636M+ in buybacks ($300M in early 2026 alone)
- Equity Residential: $506M ($206M Q4 + $300M early 2026)
- Camden: $340M+ with a new $600M authorization
- MAA: First share repurchase since 2001
- UDR and IRT: Active programs
The refinancing wall presents both risk and opportunity. Approximately $936 billion in commercial real estate mortgages mature in 2026 (MBA), with roughly $90 billion specific to multifamily. Much of this debt was originated during the 2021–2022 peak at sub-5% rates — borrowers refinancing today face agency rates starting at 5.18% and CMBS rates of 6.50–7.00%. The FHFA’s decision to raise GSE multifamily caps 20.5% to $176 billion combined provides critical liquidity, and CMBS issuance surged to $150 billion+ in 2025 (140% increase, highest since 2007). Lenders are accelerating resolution of distressed loans, with BXMT resolving $2.3 billion in troubled loans and refocusing on apartments and warehouses. The “extend and pretend” era appears to be ending — creating potential acquisition opportunities for well-capitalized investors.
Policy watch — the SFR ban moves to Capitol Hill
The week’s most significant policy development came February 19, when the White House sent draft legislative language to Congressional committee leaders formalizing its proposed ban on large investors acquiring single-family homes. As Jay Parsons detailed in his LinkedIn analysis, the proposal sets the threshold at 100 homes — meaningfully lower than the 1,000-home level many industry participants anticipated, effectively targeting mid-sized local and regional operators rather than just large institutional landlords.
The proposal includes important carve-outs that Parsons highlighted: build-to-rent is exempt, as are investors who substantially renovate homes for rental use. Critically, the ban would not force existing owners to sell their portfolios, avoiding the mass tenant displacement that would accompany forced liquidation. The Treasury Secretary would retain authority to adjust the investor threshold. The White House is seeking to attach the provision to either the Senate’s ROAD to Housing Act or the House’s Housing for the 21st Century Act (which passed 390-9 on February 9 — a remarkable show of bipartisan support).
Parsons assessed the proposal’s congressional prospects skeptically: “unlikely to pass based on congressional history,” noting the unusual political coalition it has assembled — MAGA Republicans and progressive Democrats both support restrictions on institutional homebuying, but the policy details create crosscurrents that have historically stalled such efforts. The broader housing legislative package, however, carries real momentum.
Beyond the SFR ban, several policy developments demand investor attention. HUD proposed a new rule on February 20 requiring proof of citizenship for all residents in HUD-funded housing, including mixed-status households — a change that could affect approximately 100,000+ people including 37,000 children. This intersects directly with the immigration-driven demand dynamics that Carl Whitaker flagged: South Florida counties that were “heavily dependent on international migration” face demand headwinds, with Florida’s international migration already down 56% in one year to 178,000 in 2025 from 400,000+ in 2024.
On the positive policy front for investors, the One Big Beautiful Bill (signed July 4, 2025) continues delivering benefits: the permanent 12% increase in LIHTC allocations is now taking effect, 100% bonus depreciation was made permanent, and 1031 exchanges were fully preserved after a concerted industry advocacy campaign. The FY2026 HUD budget provided a $7.2 billion increase to $77.3 billion, including $2.4 billion more for Housing Choice Vouchers. California’s zoning reform law SB 79 takes effect July 1, allowing apartments up to seven stories near train stations even in single-family zones.
Sun Belt stabilizes while Gateway markets pull ahead
The traditional Sun Belt versus Gateway market narrative is evolving in real time. Carl Whitaker’s analysis of 2024 Census migration data highlighted the persistent urban decline / suburban growth dichotomy but cautioned that “the traditional Sun Belt vs. Gateway split won’t be as clearly pronounced going forward.” The data tells a more nuanced story than simple geographic labels suggest.
Gateway market outperformance is now firmly established. San Francisco’s +6.3% rent growth reflects a tech-driven renaissance, with Essex Property Trust reporting that Northern California recovery is “finally starting to take hold” as VC funding rebounds. New York City posted +3.3% growth (Yardi Matrix), with Equity Residential calling it a “bright spot.” Chicago led the Midwest at +3.6%. These markets benefit from years of supply discipline — NYC and Chicago have added only 1–2% to their apartment stock in recent years and remain structurally undersupplied.
Sun Belt markets are stabilizing but not yet recovered. Austin remains the cautionary tale: rents down over 20% from peak, vacancy near 10%, and 65% of apartment complexes offering concessions in 2025 per CoStar. The silver lining: Austin deliveries are projected to collapse 74% in 2026 to just 4,600 units from 17,500 in 2025. Phoenix and Denver tell similar stories of markets working through oversupply, with Phoenix seeing more than 50% of rentals offering at least one month free.
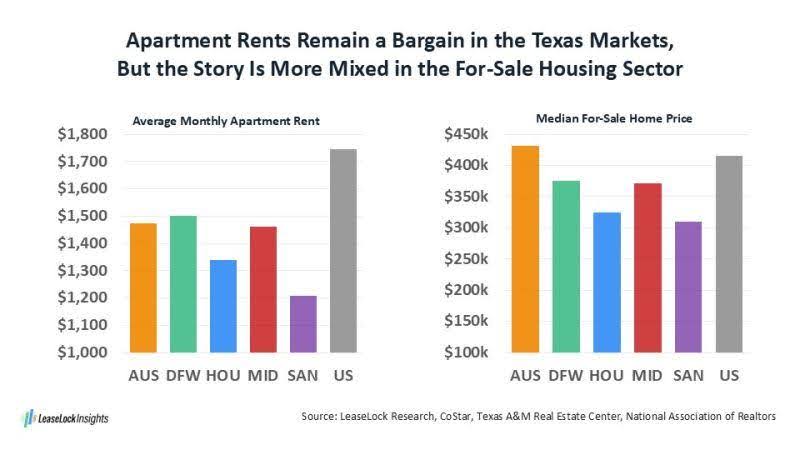
Greg Willett’s Texas housing comparison provides critical context. Despite the rent pressure, Texas apartment rents remain well below the U.S. norm: DFW sits 14% below the national average, Houston is 23% below, and San Antonio is 31% below. This affordability advantage continues to drive population growth — but Willett notes the for-sale pricing advantage is eroding, particularly in Austin, which has converged to the national average. Texas will likely remain the national population growth leader, but the magnitude of that advantage is narrowing.
Whitaker’s immigration analysis adds an important demand-side variable. South Florida counties that derived the vast majority of their population growth from international migration face a potential demand shock as immigration enforcement tightens. CoStar projects annual renter demand growth in South Florida to slow by 30% in 2026. However, Whitaker notes that Sun Belt counties like Mecklenburg (Charlotte) that depend more on domestic migration “won’t be as impacted by slowing international migration” — a meaningful distinction for investors selecting markets.
The urban-suburban split within markets also matters. Willett observed that the construction drop-off is more pronounced in urban cores, where high-rise projects require larger capital commitments and face more complex financing. Suburban Class A in recovering Sun Belt markets may actually see tighter conditions faster than downtown properties still competing with a glut of recently delivered luxury towers.
What the economists are telling us this week
The three chief economists whose LinkedIn posts anchored this week’s discourse each contributed distinct and important frameworks for understanding where the market stands.
Jay Parsons delivered the most comprehensive market assessment across six posts. His REIT earnings analysis crystallized the “survive through 2025” narrative — noting that the “survive ’til 2025” mantra many operators adopted was premature by roughly a year. He pointed to UDR, MAA, Equity Residential, Essex, and Camden all citing positive momentum, with the market likely having bottomed in October 2025. His three watchpoints: economic uncertainty, lease-up velocity on new deliveries, and concession burn-off timing. The spring leasing season beginning in March–April “will be the critical test.”
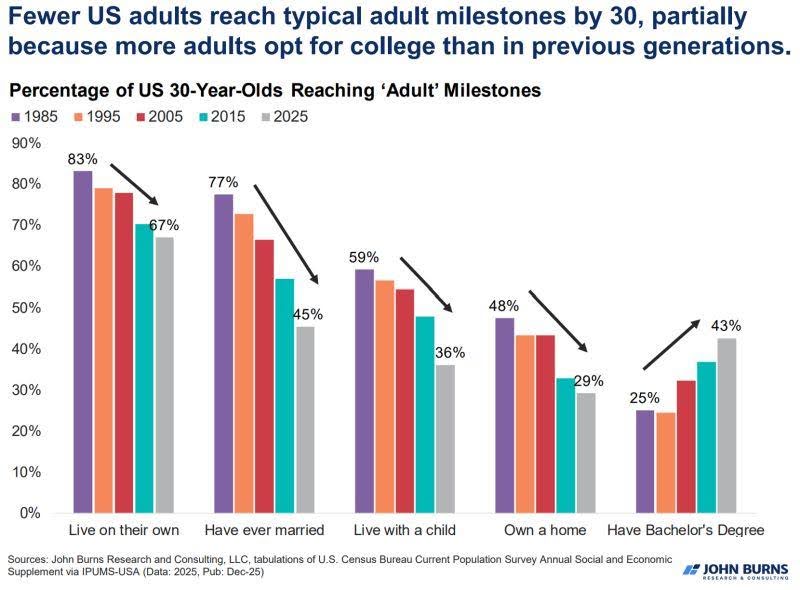
Perhaps Parsons’ most structurally significant post was on the “renting stage of life” elongating — showing steady declines since 1985 in the percentage of 30-year-olds who are married, have children, or own a home. This is not merely an affordability story; the trend persisted through ultra-low-rate environments, suggesting deeper cultural and demographic forces creating a long-term structural tailwind for multifamily demand. Rent-to-income ratios have normalized to pre-pandemic levels, further supporting the thesis.
Greg Willett (LeaseLock) focused on operational and demographic granularity. His most actionable insight was the renewal vs. move-in rent divergence: with renewals at +3.6% and move-in rents flat, the gap that has persisted since spring 2023 creates a building tension. Operators who push renewal increases too aggressively risk accelerating turnover into a market where concessions on new leases erode the economics. Those who moderate renewals sacrifice near-term revenue. This tension will define operating strategy decisions throughout 2026.
Willett’s retention analysis added a demographic dimension often overlooked: renter retention is rising primarily because renters are getting older, not because property managers are executing better retention strategies. This is a structural shift that supports occupancy but may also signal reduced mobility and household formation rates.

Carl Whitaker (RealPage) provided the geographic and migration framework. His Census data analysis challenged simplistic market categorizations, showing that the traditional Sun Belt vs. Gateway binary is breaking down. Markets within each region are diverging based on their specific migration dependency profiles and supply conditions. His warning on South Florida’s heavy reliance on international migration — and the potential for 2025 data to show significant slowdown — has material implications for Miami, Fort Lauderdale, and Palm Beach investment strategies.
Key data points of the week:
| Data point | Source | Significance |
|---|---|---|
| +550 bps new lease rate improvement since Oct | UDR earnings | Strongest market bottoming signal |
| 3.6% renewal rent growth vs. flat move-in | Willett/LeaseLock | Growing operator tension |
| +1.1M Class A renter households (3-yr) | Parsons/CoStar | Demand shifting upmarket |
| 56% drop in FL international migration | Census/Whitaker | Sun Belt demand variable |
| 60%+ supply decline from peak | MAA/Camden/AvalonBay | Recovery catalyst |
| Austin -13-17% from peak rents | Parsons/RealPage | Deepest market correction |
| 519,000 units absorbed in 2025 | Yardi Matrix | 3rd-best decade showing |
Spring leasing will separate narrative from reality
The multifamily market enters March 2026 at the most consequential inflection point since the pandemic recovery. The confluence of bottoming fundamentals, collapsing new supply, normalized rent-to-income ratios, and returning capital creates conditions for a genuine recovery. But several variables could disrupt the trajectory.
What to watch in the next 30–60 days. The spring leasing season beginning in March is, as Parsons put it, “the critical test.” Specifically, investors should monitor three metrics: the pace at which concessions burn off in high-supply markets (Austin, Phoenix, Denver), whether absorption re-accelerates from its soft second-half-2025 levels, and whether move-in rents begin converging upward toward renewal rents. If concession rates remain elevated through April, the recovery timeline extends further into late 2026 or 2027.
The macro risks are real but priced in. Consumer confidence near decade lows, GDP growth decelerating, job gains concentrated in a single sector, and FOMC uncertainty all argue for caution. UDR’s guidance assumptions of just 30,000 new jobs per month nationally (down from 80,000 in 2025) reflects this sobriety. The Supreme Court’s February 20 ruling striking down broad emergency tariffs adds another variable — potential tariff refunds could provide consumer stimulus, but the administration’s pledge to reimpose tariffs creates ongoing uncertainty.
The refinancing wall creates bifurcated outcomes. Well-capitalized operators with agency financing will navigate 2026 comfortably. Overleveraged borrowers who acquired at peak valuations with floating-rate bridge debt face existential decisions. The end of “extend and pretend” means distressed assets will increasingly trade, creating acquisition opportunities that haven’t existed at this scale since 2010–2012.
The structural demand story remains intact. Parsons’ demographic data on the elongating “renting stage of life,” combined with the persistent homeownership affordability gap ($1,200/month mortgage premium over average rent, with only 12.7% of renters able to afford a median-priced home), ensures multifamily demand has a floor. The question is not whether demand exists — it’s whether the economic environment generates enough job growth and wage gains to convert latent demand into signed leases.
For investors positioning today, the consensus view among all three economists points to a market that has turned the corner but still requires patience. Parsons’ assessment that recovery “is still gonna take some time” and his revised mantra of “survive through 2025″ both suggest the bottom is in but the acceleration phase hasn’t started. Markets with the steepest supply declines and most diversified demand drivers — think Charlotte, Atlanta, and Dallas-Fort Worth rather than Austin or Jacksonville — are likely to recover first. Gateway markets like San Francisco, New York, and Chicago may offer the best near-term fundamentals but at tighter cap rates. The next eight weeks will reveal whether the bottoming signals are the beginning of a sustained recovery or a false spring.